import matplotlib.pyplot as plt
import matplotlib.image as mpimg
import numpy as np
import cv2
import math
img = cv2.imread("lane.png")
img = cv2.cvtColor(img,cv2.COLOR_BGR2RGB)
def grayscale(img):
'''灰度变换'''
return cv2.cvtColor(img,cv2.COLOR_RGB2GRAY)
def canny(img,low_threshold,high_threshold):
'''边缘检测'''
return cv2.Canny(img,low_threshold,high_threshold)
def gaussian_blur(img,kernel_size):
'''高斯去噪'''
return cv2.GaussianBlur(img,(kernel_size,kernel_size),0)
def median_blur(img,kernel_size):
'''高斯去噪'''
return cv2.medianBlur(img,kernel_size)
def region_of_interest(img,vertices):
'''兴趣域'''
mask = np.zeros_like(img)
if len(img.shape)>2:
channel_count = img.shape[2]
ignore_mask_color = (255,)*channel_count
else:
ignore_mask_color = 255
cv2.fillPoly(mask,vertices,ignore_mask_color)
img_masked = cv2.bitwise_and(img,mask)
return img_masked
def draw_lines(img,lines,color=[255,0,0],thickness=2):
'''绘制直线'''
if not lines.any():
return
for line in lines:
for x1,y1,x2,y2 in line:
cv2.line(img,(x1,y1),(x2,y2),color,thickness)
def get_y_intercepts(lines,slopes):
'''根据输入线段的斜率,计算对应y方向的截距和平局斜率'''
slopes = slopes[~np.isnan(slopes)]
slopes = slopes[~np.isinf(slopes)]
avg_slope = slopes.mean()
lines = lines.reshape((lines.shape[0]*2,lines.shape[1]//2))
x_mean,y_mean = np.mean(lines,axis=0)
return y_mean - (x_mean*avg_slope),avg_slope
def get_x_intercepts(y_1,y_2,slope,b):
'''根据斜率和截距,及计算对应y值的x'''
if not (~np.isnan(slope) and ~np.isnan(b)):
x_1 = x_2 = 0
else:
x_1 = (y_1-b)/slope
x_2 = (y_2-b)/slope
return x_1,x_2
prev_left_x1=prev_left_x2=prev_right_x1=prev_right_x2=0
prev_left_avg_m,prev_right_avg_m=-1,1
prev_left_b=prev_right_b=prev_left_line=prev_right_line=0
def draw_lines_extrapolated(img,lines,color=[255,0,0],thickness=3):
imgshape=img.shape
lines = lines.reshape((lines.shape[0],lines.shape[2]))
y_min = lines.reshape((lines.shape[0]*2,lines.shape[1]//2))[:,1].min()
slopes = (lines[:,3]-lines[:,1])/(lines[:,2]-lines[:,0])
slopes = slopes[~np.isnan(slopes)]
slopes = slopes[~np.isinf(slopes)]
left_lines = lines[slopes<-0.5]
right_lines = lines[slopes>0.5]
left_slopes = slopes[slopes<-0.5]
right_slopes = slopes[slopes>0.5]
global prev_left_avg_m
global prev_right_avg_m
global prev_left_b
global prev_right_b
left_b,left_avg_m = get_y_intercepts(left_lines,left_slopes)
right_b,right_avg_m = get_y_intercepts(right_lines,right_slopes)
keep_prev_left = False
keep_prev_right = False
if left_avg_m < -0.83 or left_avg_m > -0.36:
left_avg_m = prev_left_avg_m
left_b = prev_left_b
keep_prev_left = True
if right_avg_m > 0.83 or right_avg_m < 0.36:
right_avg_m = prev_right_avg_m
right_b = prev_right_b
keep_prev_right = True
prev_left_avg_m = left_avg_m
prev_right_avg_m = right_avg_m
prev_left_b = left_b
prev_right_b = right_b
left_x1,left_x2 = get_x_intercepts(y_1=y_min,y_2=imgshape[0],slope=left_avg_m,b=left_b)
right_x1,right_x2 = get_x_intercepts(y_1=y_min,y_2=imgshape[0],slope=right_avg_m,b=right_b)
global prev_left_x1
global prev_left_x2
global prev_right_x1
global prev_right_x2
if prev_left_x1 != 0 or prev_left_x2 != 0 or prev_right_x1 != 0 or prev_right_x2 != 0:
alpha = 0.2
left_x1_new = math.floor(alpha*left_x1+(1-alpha)*prev_left_x1)
left_x2_new = math.floor(alpha*left_x2+(1-alpha)*prev_left_x2)
right_x1_new = math.floor(alpha*right_x1+(1-alpha)*prev_right_x1)
right_x2_new = math.floor(alpha*right_x2+(1-alpha)*prev_right_x2)
prev_left_x1 = left_x1_new
prev_left_x2 = left_x2_new
prev_right_x1 = right_x1_new
prev_right_x2 = right_x2_new
else:
left_x1_new = left_x1
left_x2_new = left_x2
right_x1_new = right_x1
right_x2_new = right_x2
prev_left_x1 = left_x1_new
prev_left_x2 = left_x2_new
prev_right_x1 = right_x1_new
prev_right_x2 = right_x2_new
left_line = np.array([left_x1_new,y_min,left_x2_new,imgshape[0]],dtype=np.int32)
right_line = np.array([right_x1_new,y_min,right_x2_new,imgshape[0]],dtype=np.int32)
if keep_prev_left:
left_line = prev_left_line
left_x1_new = prev_left_x1
left_x2_new = prev_left_x2
if keep_prev_right:
right_line = prev_right_line
right_x1_new = prev_right_x1
right_x2_new = prev_right_x2
cv2.line(img,(int(left_x1_new),int(y_min)),(int(left_x2_new),int(imgshape[0])),color,thickness)
cv2.line(img,(int(right_x1_new),int(y_min)),(int(right_x2_new),int(imgshape[0])),color,thickness)
def hough_line(img,rho,theta,threshold,min_line_len,max_line_gap,extrapolate=False):
'''
img:canny检测后的图像
rho:hough检测中grid像素距离
theta:grid角度距离
threshold:最小voting数值
min_line_len:构成线的最小像素个数
max_line_gap:相连线段之间的最大距离
extrapolate:
返回黑背景上有白线的图
'''
lines = cv2.HoughLinesP(img,rho,theta,threshold,np.array([]),minLineLength=min_line_len,maxLineGap=max_line_gap)
img_line = np.zeros((img.shape[0],img.shape[1],3),dtype=np.uint8)
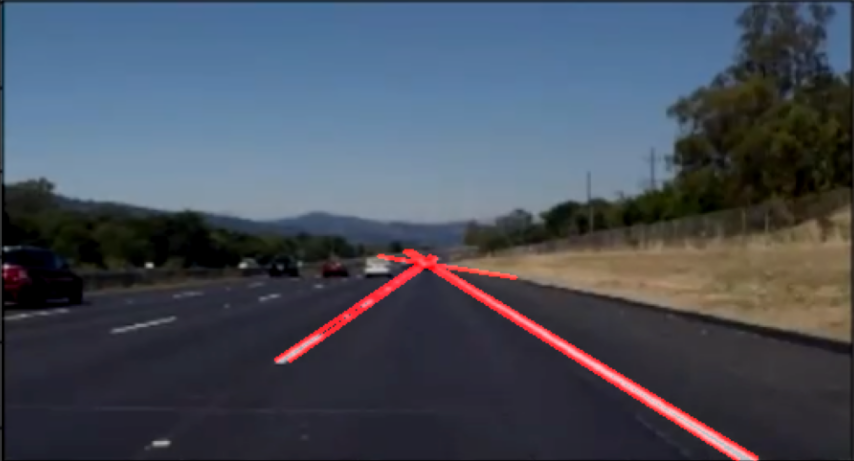
if not extrapolate:
draw_lines(img_line,lines)
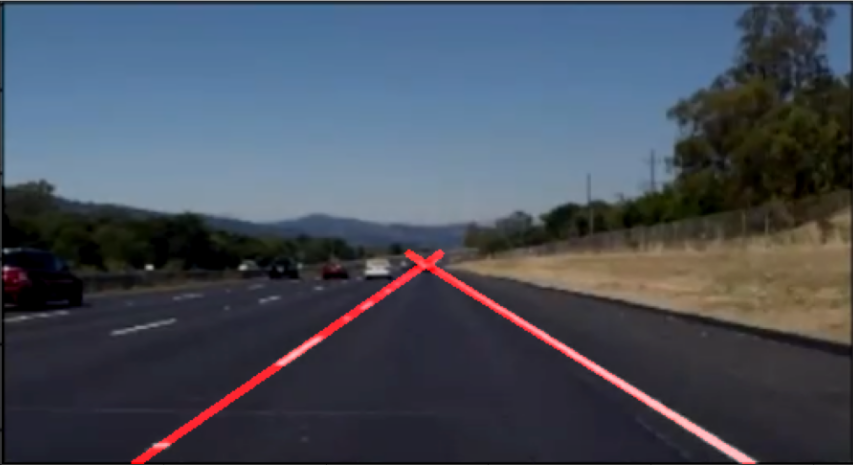
else:
draw_lines_extrapolated(img_line,lines)
return img_line
def weighted_img(img,initial_img,a=0.8,b=1):
'''
img:hough检测输出
initial_img:原始图像
加权相加:initial_img*a + img*b
'''
return cv2.addWeighted(initial_img,a,img,b,0)
|